


Opens in a new tab. Your article title and link are shared only with the AI assistant you choose.
A local search grid can reveal customers your Google Maps rankings fail to reach, even when your business appears first nearby. BrightLocal reported in July 2026 that 84% of surveyed U.S. consumers searched online for a local business in the previous three months. Its research also found that 71% used Google Search during their latest local business search.
Searches happen across neighborhoods, not just outside your storefront, and rankings can change between nearby streets. A top result downtown might disappear several miles away, allowing competitors to win valuable inquiries. Here you will learn to configure scans, interpret heatmaps, fix weaknesses, and connect local visibility with leads.
What Is a Local Search Grid and Why Do Rankings Vary?
Understand Geographic Ranking Differences
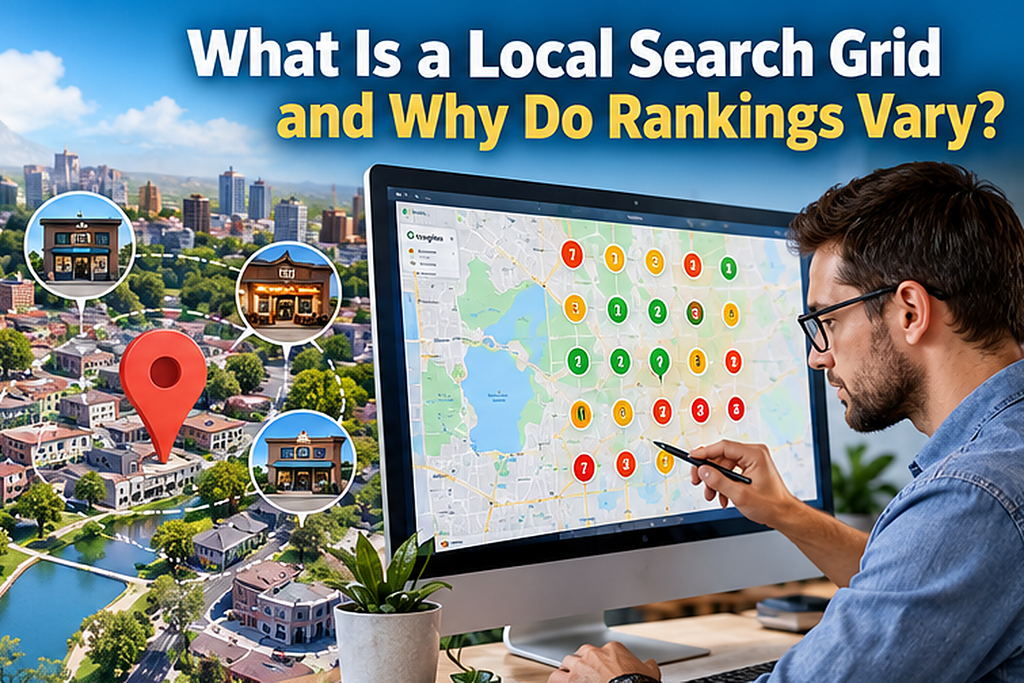
A local search grid is a map-based ranking report that checks where a business appears for one keyword from multiple geographic coordinates. Instead of showing one position for an entire city, it displays a series of numbered points, often colored to indicate stronger and weaker rankings. You can quickly see whether your visibility reaches the neighborhoods where customers actually live, work, or search.
Google says local results depend mainly on relevance, distance, and prominence. A dentist can rank near its office yet trail established clinics across town. That does not automatically indicate a technical problem.
A regular rank checker answers where you appeared from one reference point, while a grid answers how your presence changes across an area. You can know where you rank with local rank tracker by examining positions on a map instead of relying on one citywide number. That geographic view helps you distinguish strong coverage from isolated rankings without assuming every low-ranking pin needs the same solution.
The opportunity matters because BrightLocal found in 2025 that one in five consumers searched locally within map apps. Its July 2026 research found that 75% used multiple channels during their latest local business search. A grid therefore measures geographic visibility, not the entire journey to purchase.
Set your grid around actual customers and choose practical spacing. A 3×3 checks nine pins, a 5×5 checks 25, and a 7×7 checks 49, often at increasing cost. Preserve keywords, coordinates, and settings for later comparisons.
Must-know Tip: Start with keywords describing services customers genuinely buy from you. Avoid tracking empty areas or distant neighborhoods outside your market. A targeted grid usually delivers clearer decisions than an oversized scan.
How to Read Heatmaps and Calculate Local Visibility
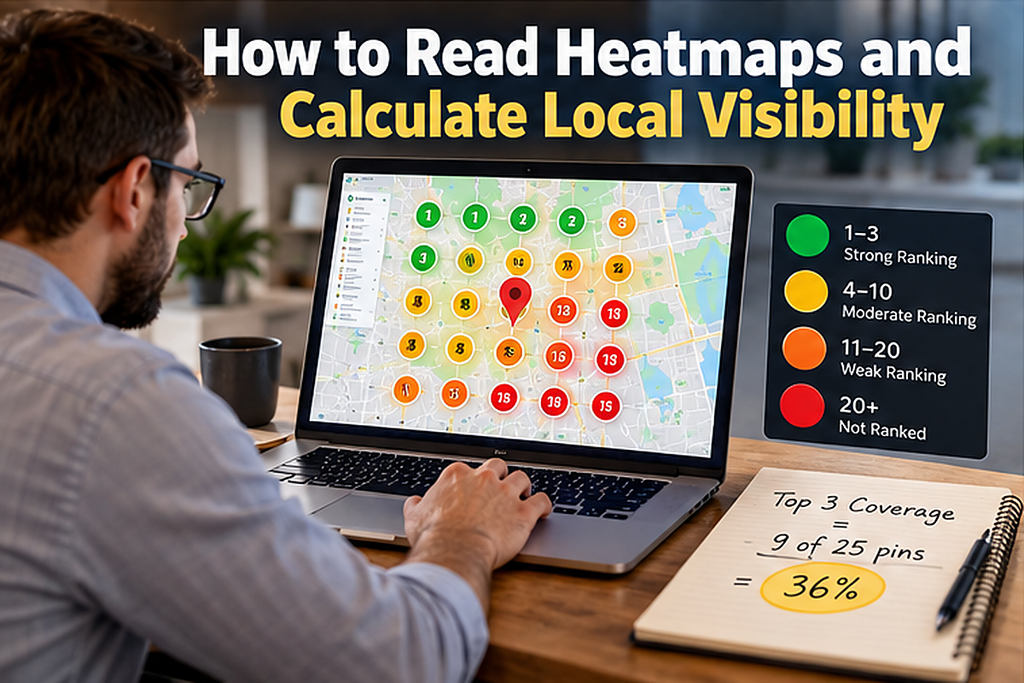
Most grid tools use green for stronger placements, yellow or orange for weaker first-page visibility, and red for low or unranked positions. Color thresholds vary by platform, so check the legend before comparing reports from different providers. A cluster of red points west of your office might reflect distance, stronger competitors, poor keyword relevance, or a mixture of all three.
Calculate Top-Three Coverage and Average Rank
Count the measurement points where your business ranks in positions one through three, then divide that number by the total number of pins. If nine of 25 pins show top-three rankings, your top-three coverage is 36% for that specific keyword and scan. This is a geographic coverage metric, not a claim that you received 36% of local searches or customers.
Tools handle unranked positions differently, making average rank harder to compare. Add recorded positions and divide by your pin count, applying a stated rule to missing rankings. Share of Local Voice also varies by provider, so define its calculation clearly.
Consumer trust provides context for how much a ranking may be worth. BrightLocal’s 2026 survey found that 47% of consumers would avoid businesses with fewer than 20 reviews, 74% cared only about reviews from the previous three months, and 31% would use only businesses rated at least 4.5 stars. These are survey responses about choosing businesses, not evidence that collecting a particular review count guarantees better Maps rankings.
Must-know Tip: Myles Anderson, BrightLocal’s co-founder and CEO, described reviews in its 2026 report as “stable, sticky, and more important than ever.” His observation highlights how visibility and consumer trust interact after a potential customer discovers a listing. Read grid rankings alongside profile quality, not in isolation.
How to Improve Weak Google Maps Rankings Without Guesswork
Diagnose the Pattern Before Taking Action
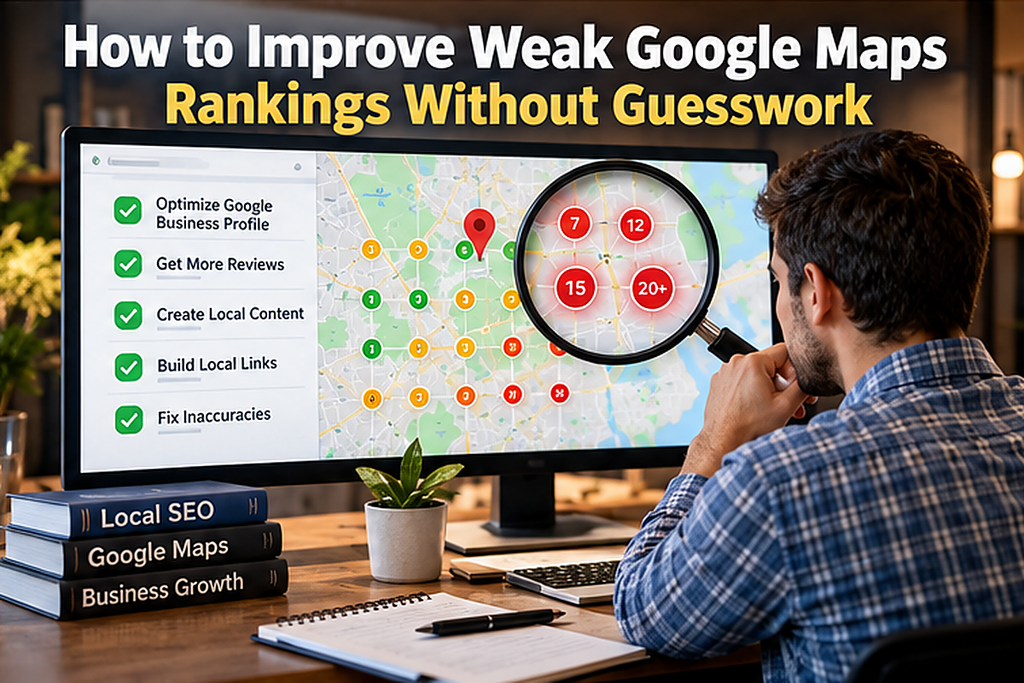
Before changing anything, check whether weak rankings form a cluster or one isolated point. Note which competitors win repeatedly and whether they are closer to those coordinates. Then investigate relevance, categories, content, and listing accuracy rather than guessing.
Your diagnostic checklist should cover:
- Correct Google Business Profile category, address or service area, hours, and services.
- Real customer reviews, thoughtful owner responses, and accurate business information.
- Useful location-specific website content and genuinely relevant local links.
- Duplicate or suspicious competitor listings that may require documented investigation.
- Consistent scan settings before declaring any ranking change meaningful.
Google does not sell better local positions, and a wider service area does not cancel distance. For hidden-address businesses, measure legitimate service neighborhoods while following Google’s address rules. Report suspicious competitor listings through proper channels only with supporting evidence.
Prioritize weak zones where nearby residents actually search for your services. A plumber may care more about a suburban neighborhood than an equally red industrial district. Commercial relevance should guide your fixes, not just the number of red pins.
The customer experience deserves attention alongside technical fixes. BrightLocal found in 2025 that 85% of consumers valued accurate contact details and hours, while its 2026 study found 97% read business reviews. Its 2026 survey also reported that 89% expected review responses and 80% were likely to use businesses that answered every review.
Must-know Tip: A red square is a question, not a diagnosis. Write down your likely explanation and supporting evidence before taking action. Change one meaningful variable at a time where practical, then compare results across several stable scans.
How to Turn Local Search Grid Data Into More Leads

Ranking gains matter when they increase discovery by customers who can actually hire, visit, or buy from you. Compare recurring grid scans with Google Business Profile calls, direction requests, website clicks, and your own qualified-lead records. Google explains that Business Profile call counts represent call-button clicks, so never report them as confirmed answered calls or completed sales.
Illustrative Case Study: An Austin HVAC Company
Consider a fictional Austin company, Cedar Air Service, tracking air conditioner repair on a 5×5 grid. Its starting scan shows top-three rankings at six of 25 points, or 24% coverage, with especially weak results in a nearby residential neighborhood. The company discovers that its main service page poorly explains emergency repairs and that its service information needs clarification.
It updates its service page, corrects inaccurate listing details, and invites honest, non-incentivized reviews. Later, nine pins reach the top three, lifting coverage to 36%, but that cannot prove which change helped. The company checks qualified calls and bookings before claiming a business improvement.
A Practical 30-Day Measurement Plan
During week one, record baseline grids, lead totals, and current listing information. In week two, fix verified inaccuracies and strengthen the most useful service content, then monitor relevant competitors in week three. During week four, compare identical scans and assess whether leads improved, while recognizing that a month may be too short to establish a reliable causal effect.
BrightLocal found in 2026 that 54% visited a business website after positive reviews and 66% continued researching. Your website and booking experience therefore matter alongside map visibility. Prioritize neighborhoods with both achievable rankings and real customer demand.
Conclusion
A local search grid turns a vague claim about your Google Maps position into a measurable picture of geographic visibility. It shows where your business appears consistently, where nearby competitors win, and which areas deserve closer investigation. The useful question is not simply whether the map becomes greener, but whether it helps more relevant customers find and choose your business.
Compare consistent keywords, coordinates, grid sizes, and reporting periods. Pair rankings with accurate listings, honest reviews, useful pages, and conversion data. This prevents temporary ranking movement from masquerading as genuine, lasting business growth.
Start with one valuable service keyword and a grid that matches your actual market. Establish your baseline, document each change, and review trends before changing direction again. The questions below address common tracking choices and help you avoid the mistakes that make geo-grid reports misleading.
Frequently Asked Questions About Local Search Grid
What Does a Local Search Grid Measure?
It shows rankings from multiple geographic points. Each point reflects one search location. The resulting map reveals strong and weak coverage.
Is Local Search Grid the Same as Google Search Console?
No. Search Console reports website search performance. Geo-grid tools measure location-based map rankings for selected queries.
What Is the Best Grid Size for a Small Business?
A 5×5 grid offers a useful starting point. It checks 25 locations. Adjust spacing according to your real service market.
How Often Should I Run a Grid Scan?
Weekly scans work for active campaigns. Monthly checks may suit stable markets. Compare scans under consistent conditions.
Why Do Rankings Change Across Nearby Streets?
Google considers location when ranking local businesses. Nearby competitors also differ. Even small geographic changes can reshape results.
What Does a Red Pin Mean on a Local Search Grid?
It generally indicates weak visibility. Exact thresholds depend on the tool. Read the legend before drawing conclusions.
Can Service-Area Businesses Use Local Search Grid Tools?
Yes. They can measure rankings in places they serve. Hiding an address does not remove distance considerations.
What Is a Good Top-Three Coverage Percentage?
There is no universal target. Compare your coverage with relevant competitors. Prioritize commercially valuable neighborhoods over irrelevant areas.
Are Grid Rankings Actual Customer Searches?
No. Grids simulate searches at selected coordinates. Real outcomes vary by timing and context.
How Do I Know Whether Local SEO Is Producing Leads?
Track relevant calls, requests, and bookings. Compare them with ranking trends. Verify lead quality before claiming a return.



Comments
0 responsesNo comments yet. Be the first to share your thoughts.